
Tableau 10 Puts Control Back In IT Hands- Valutrics
Data visualization platform provider Tableau is updating its flagship product with new features that give oversight and data governance control back to IT organizations. It also makes a host of new advanced analytics capabilities accessible to more users.

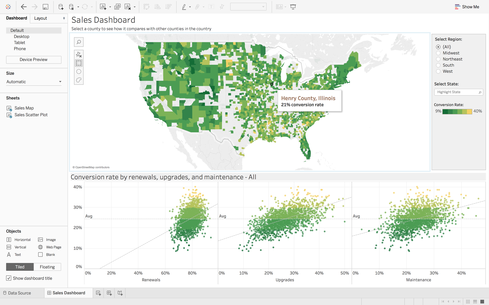
(Click image for larger view and slideshow.)
The trouble with many analytics projects is that even though they are designed to deliver information and insight to users, the process of moving data, cleaning data, and integrating data can take time. And when business users want to turn on a dime and make decisions, they don’t want to wait.
So sometimes they go around IT to get alternate solutions implemented.
Platforms such as Tableau have tried to speed up the process by offering self-service tools to users, enabling non-IT workers to create data visualizations quickly without the need to involve IT. Now, with its upcoming release of Tableau 10, the data visualization company is putting some control back into the hands of the IT organization.
[Tableau is one of the market Leaders in Gartner’s Magic Quadrant for BI and Analytics. Find out who the other two are. Read Gartner BI Magic Quadrant: Inflection Point Has Arrived.]
Tableau’s vice president of product development Francois Ajenstat spoke with InformationWeek. He provided a preview on the strategy behind the improvements in the soon to be released update to the company’s data visualization and analytics platform.
Among the new features: Data integration or mashups of data from multiple different sources; the addition of many different new advanced analytics including drag-and-drop clustering; greater mobile responsiveness, and new capabilities for developers.
(Image: Tableau)
For IT organizations, one of the most welcome new features is probably the greater levels of control over the platform itself. Ajenstat said Tableau 10 is not just an analytics platform itself. The platform also has an additional analytics platform built on top of it to provide visibility into how users are using Tableau.
“In the past with traditional business intelligence tools, IT controlled everything and built the reports, and delivered them to the users,” Ajenstat said. “In the new modern analytics world everything is self-service, so IT doesn’t have the same control or understanding of what is going on out there. So having this ability back means they can better tune their environments. They can provide oversight and governance over what is being used.”
Tableau 10 also adds analytics version control. That means when users are working on analysis projects and decide they want to make changes or revert back to a previous version, they can revert natively inside the platform, Ajenstat said.
Data Mashups
Tableau 10 is also adding data mashups. The company has already supported over 50 different data sources out of the box, from Oracle to DB2 to cloud databases, to SQL on Azure, to Hadoop. It also supports applications such as Salesforce and Google Analytics. Version 10 adds native support for Google Sheets and QuickBooks.
Plus, it expands the capabilities related to linking to these data sources. On previous versions of the platform you had to connect to one source at a time. Tableau 10 enables users to connect to any data source and combine it with any other data source with a simple point-and-click action. A user could now work with SQL Server, Oracle, and Hadoop as a single integrated data source, Ajenstat told InformationWeek.
“If you didn’t have this capability, you would struggle with ETL or put it in Excel,” he said. “This is one of the game-changer capabilities in Tableau 10.”
That’s not to say it can’t be done. But it’s not something that a non-IT user would be able to do.
“You don’t have to be technical to do this,” Ajenstat said. “It feels as if it is just one data source. This will open up new scenarios.”
Advanced Analytics
Tableau 10 is also making some sophisticated advanced analytics capabilities, such as clustering, available to end-users via drag-and-drop functions. Ajenstat says this unleashes capabilities that have been available to data scientists via tools such as SAS, SPSS, and R, and makes them available to more people.
Mobility
Another new capability in the platform enables dashboards, apps, and reports that are sometimes delivered to mobile devices to be automatically optimized for consumption on those devices.
The company is running the largest beta its ever done — two-times bigger than ever before — with 13,000 people from Tableau’s 42,000 customers. Tableau officials said that the official release is coming shortly.
“This is the most significant release we’ve ever made,” Ajenstat told InformationWeek.
(Cover image: Deepak Budhraja/iStockphoto)
Jessica Davis has spent a career covering the intersection of business and technology at titles including IDG’s Infoworld, Ziff Davis Enterprise’s eWeek and Channel Insider, and Penton Technology’s MSPmentor. She’s passionate about the practical use of business intelligence, … View Full Bio